Forecast
A model assigns scores or predicts a future change. This is the familiar offline leaderboard.
PEG-Bench
Benchmarking the Prediction-Execution Gap
Prediction rankings can reverse after costs, turnover, and risk.
Visual abstract / six-panel result
Real-world problem
In plain language
A forecast is not the same thing as an action. Two models can predict the same direction, but one may change position much more often. Fees and slippage can erase that model's apparent advantage before the decision produces a useful outcome.
The problem is not limited to markets. It appears whenever a prediction is converted into a constrained action: a treatment choice, a recommendation, a resource allocation, or a control signal.
Formal question
Given the same forecasts, chronological split, forecast-to-action interface, cost schedule, and risk rules, does the R0 prediction leader remain the R4 execution-aware leader?
PEG-Bench treats this as an evaluation problem. It does not treat the market setting as evidence of a deployable trading strategy.
Prediction score -> constrained action -> realized utility
Plain-language concept
Prediction score -> constrained action -> realized utility
A model assigns scores or predicts a future change. This is the familiar offline leaderboard.
A policy turns the score into an exposure, recommendation, or control move with a frequency and size.
The action meets fees, slippage, drawdown limits, and distribution shift. Utility is measured here.
Prediction proxy: RankIC, directional accuracy, and errors.
Costs: the fee schedule is applied to the same action path.
Execution: turnover, slippage, and action activity become visible.
Risk: drawdown and path-dependent utility are included.
Stress: regimes, survival, and robustness test the conclusion.
Experiment design
The completed evidence slice is deliberately narrow. That narrowness lets a reader distinguish a measured result from a future benchmark target.
| Dimension | Frozen specification | Why it matters |
|---|---|---|
| Data window | 2025-09-28 to 2025-12-26 UTC; BTCUSDT and ETHUSDT; Binance and OKX. | Fixes the population before comparing methods. |
| Chronology | 60 / 15 / 15 train, validation, and test; 15 held-out test days. | Prevents future information from entering training or tuning. |
| Panels | Time and volume views at horizons 5, 20, and 50. | Shows whether a conclusion holds across six matched views. |
| Friction | 0 / 1 / 3 / 5 / 10 bps cost ladder; 3 bps headline report card. | Tests whether small implementation costs change the ranking. |
| Evidence unit | One view-horizon panel with R0, R4, gap, risk, stress, and audit fields. | Keeps every claim tied to a traceable result object. |
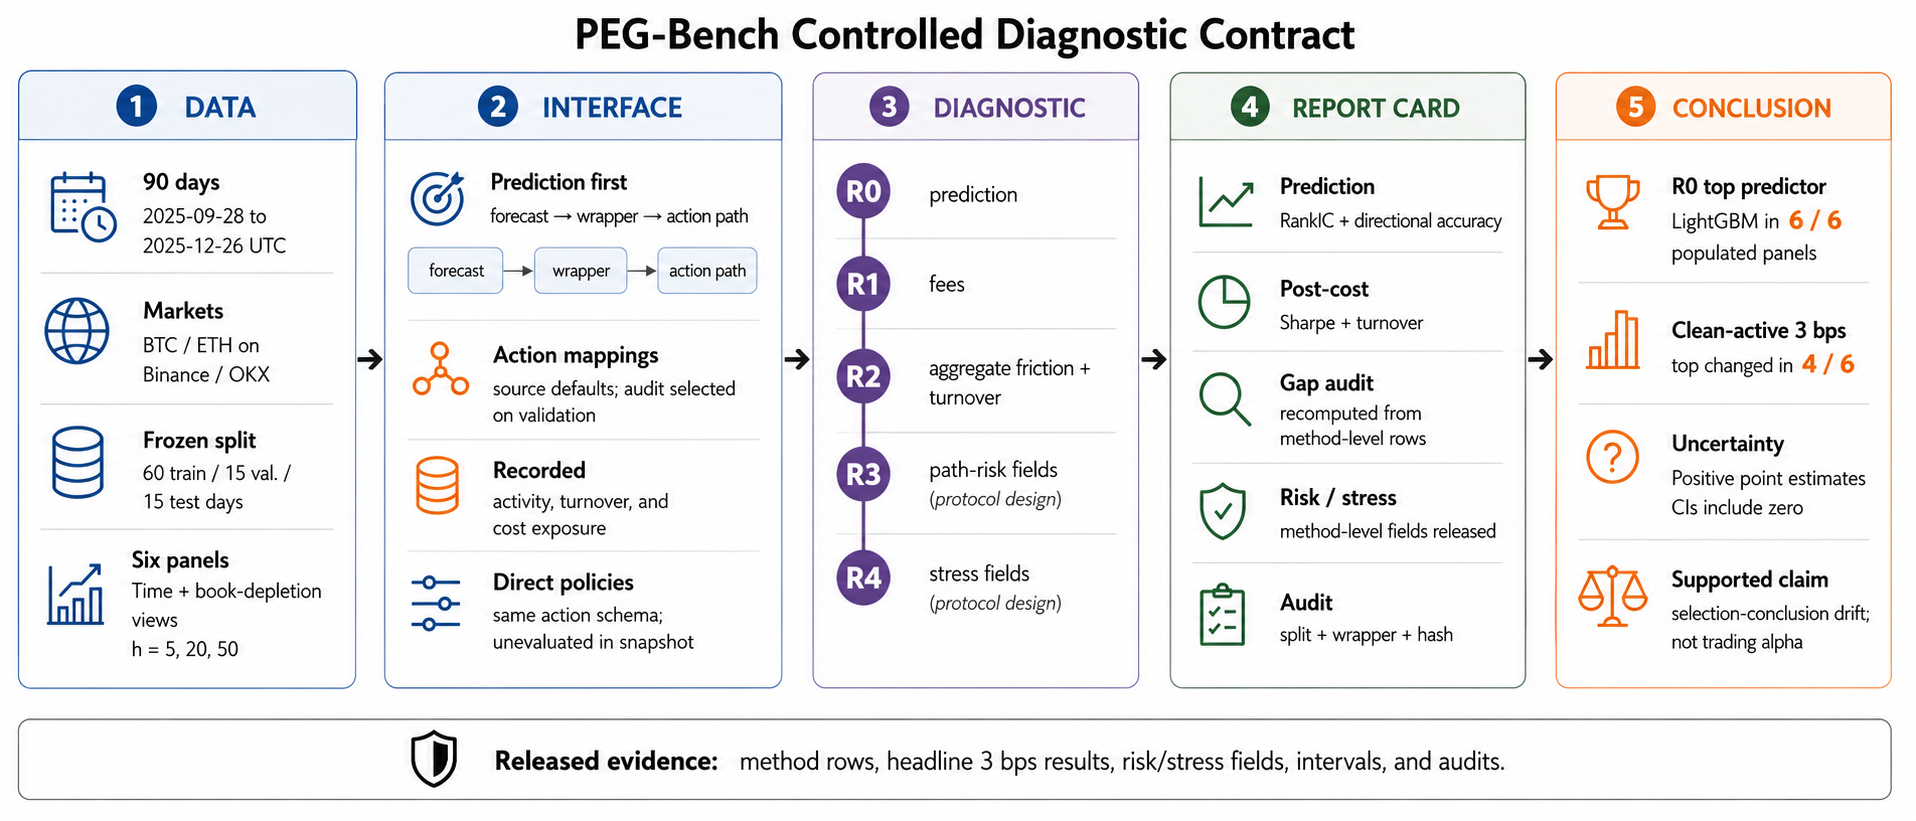
Core contract tableChronological splitRealism ladderOpen the full-resolution contract figure
Cost sensitivity
Fixed fee ladder available in the normalized 90-day reports.
Headline setting for the clean-active R4 comparison and displayed report card.
Other fee settings are released as supporting sensitivity evidence, not as separately rerun headline claims.
Mechanism interaction
The gap is not one hidden penalty. It is an interaction between the signal, the action rule, the path of positions, and the conditions under which those positions are evaluated.
| Mechanism | Plain-language effect | Report-card signal |
|---|---|---|
| Action frequency | A small forecast difference can trigger many more position changes. | Turnover, fees, slippage |
| Position path | The same average prediction can create a very different drawdown path. | Sharpe, maximum drawdown, recovery |
| Regime shift | A rule that worked in one market condition can lose its ordering in another. | Worst-regime utility, stress survival |
| Safety floors | No-action or anchor rows can look strong on a utility floor without being active model winners. | Clean-active eligibility rule |
Toy illustration
Model A can have the higher RankIC but switch positions every bar. Model B can have a lower RankIC and hold a steadier position. Once a fee is charged for each switch, B may have the stronger R4 point estimate. This is the mechanism PEG-Bench measures; it is not a claim that either model is profitable in production.
Evidence results
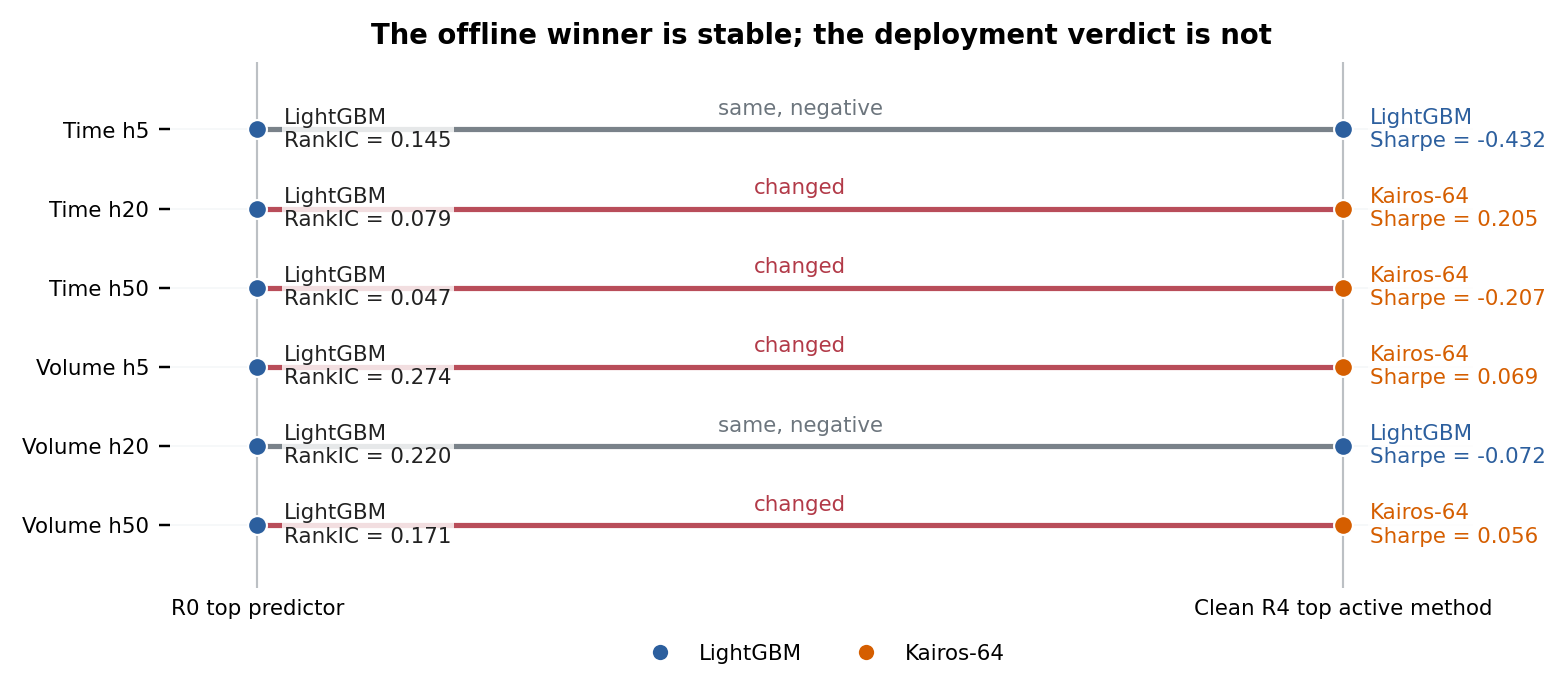
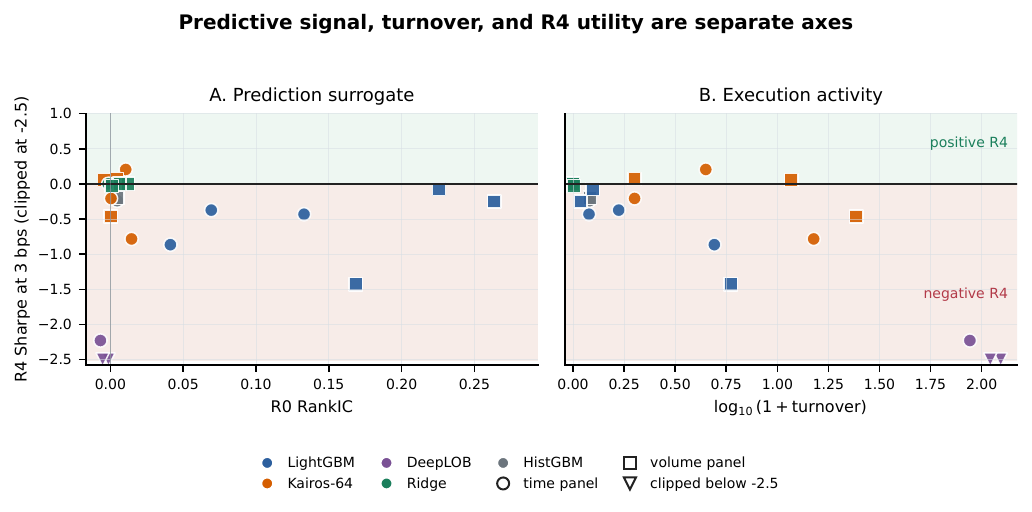
LightGBM is the RankIC leader among populated prediction-first rows in all six panels. At 3 bps, the clean-active R4 identity changes in four panels. The confidence intervals below make clear where the R4 point estimates remain uncertain.
Official prediction-first
All normalized prediction-first rows under the frozen split. RR@1 uses deterministic stable sorting at k=1.
Clean-active R4
Active model identity after zero-action safety-floor rows and non-active anchors are excluded from the active comparison.
Diagnostic
Wrapper and formal-method rows inform sensitivity but do not replace the clean ranked leaderboard.
Target only
Method families without normalized 90-day evidence under the shared evaluator.
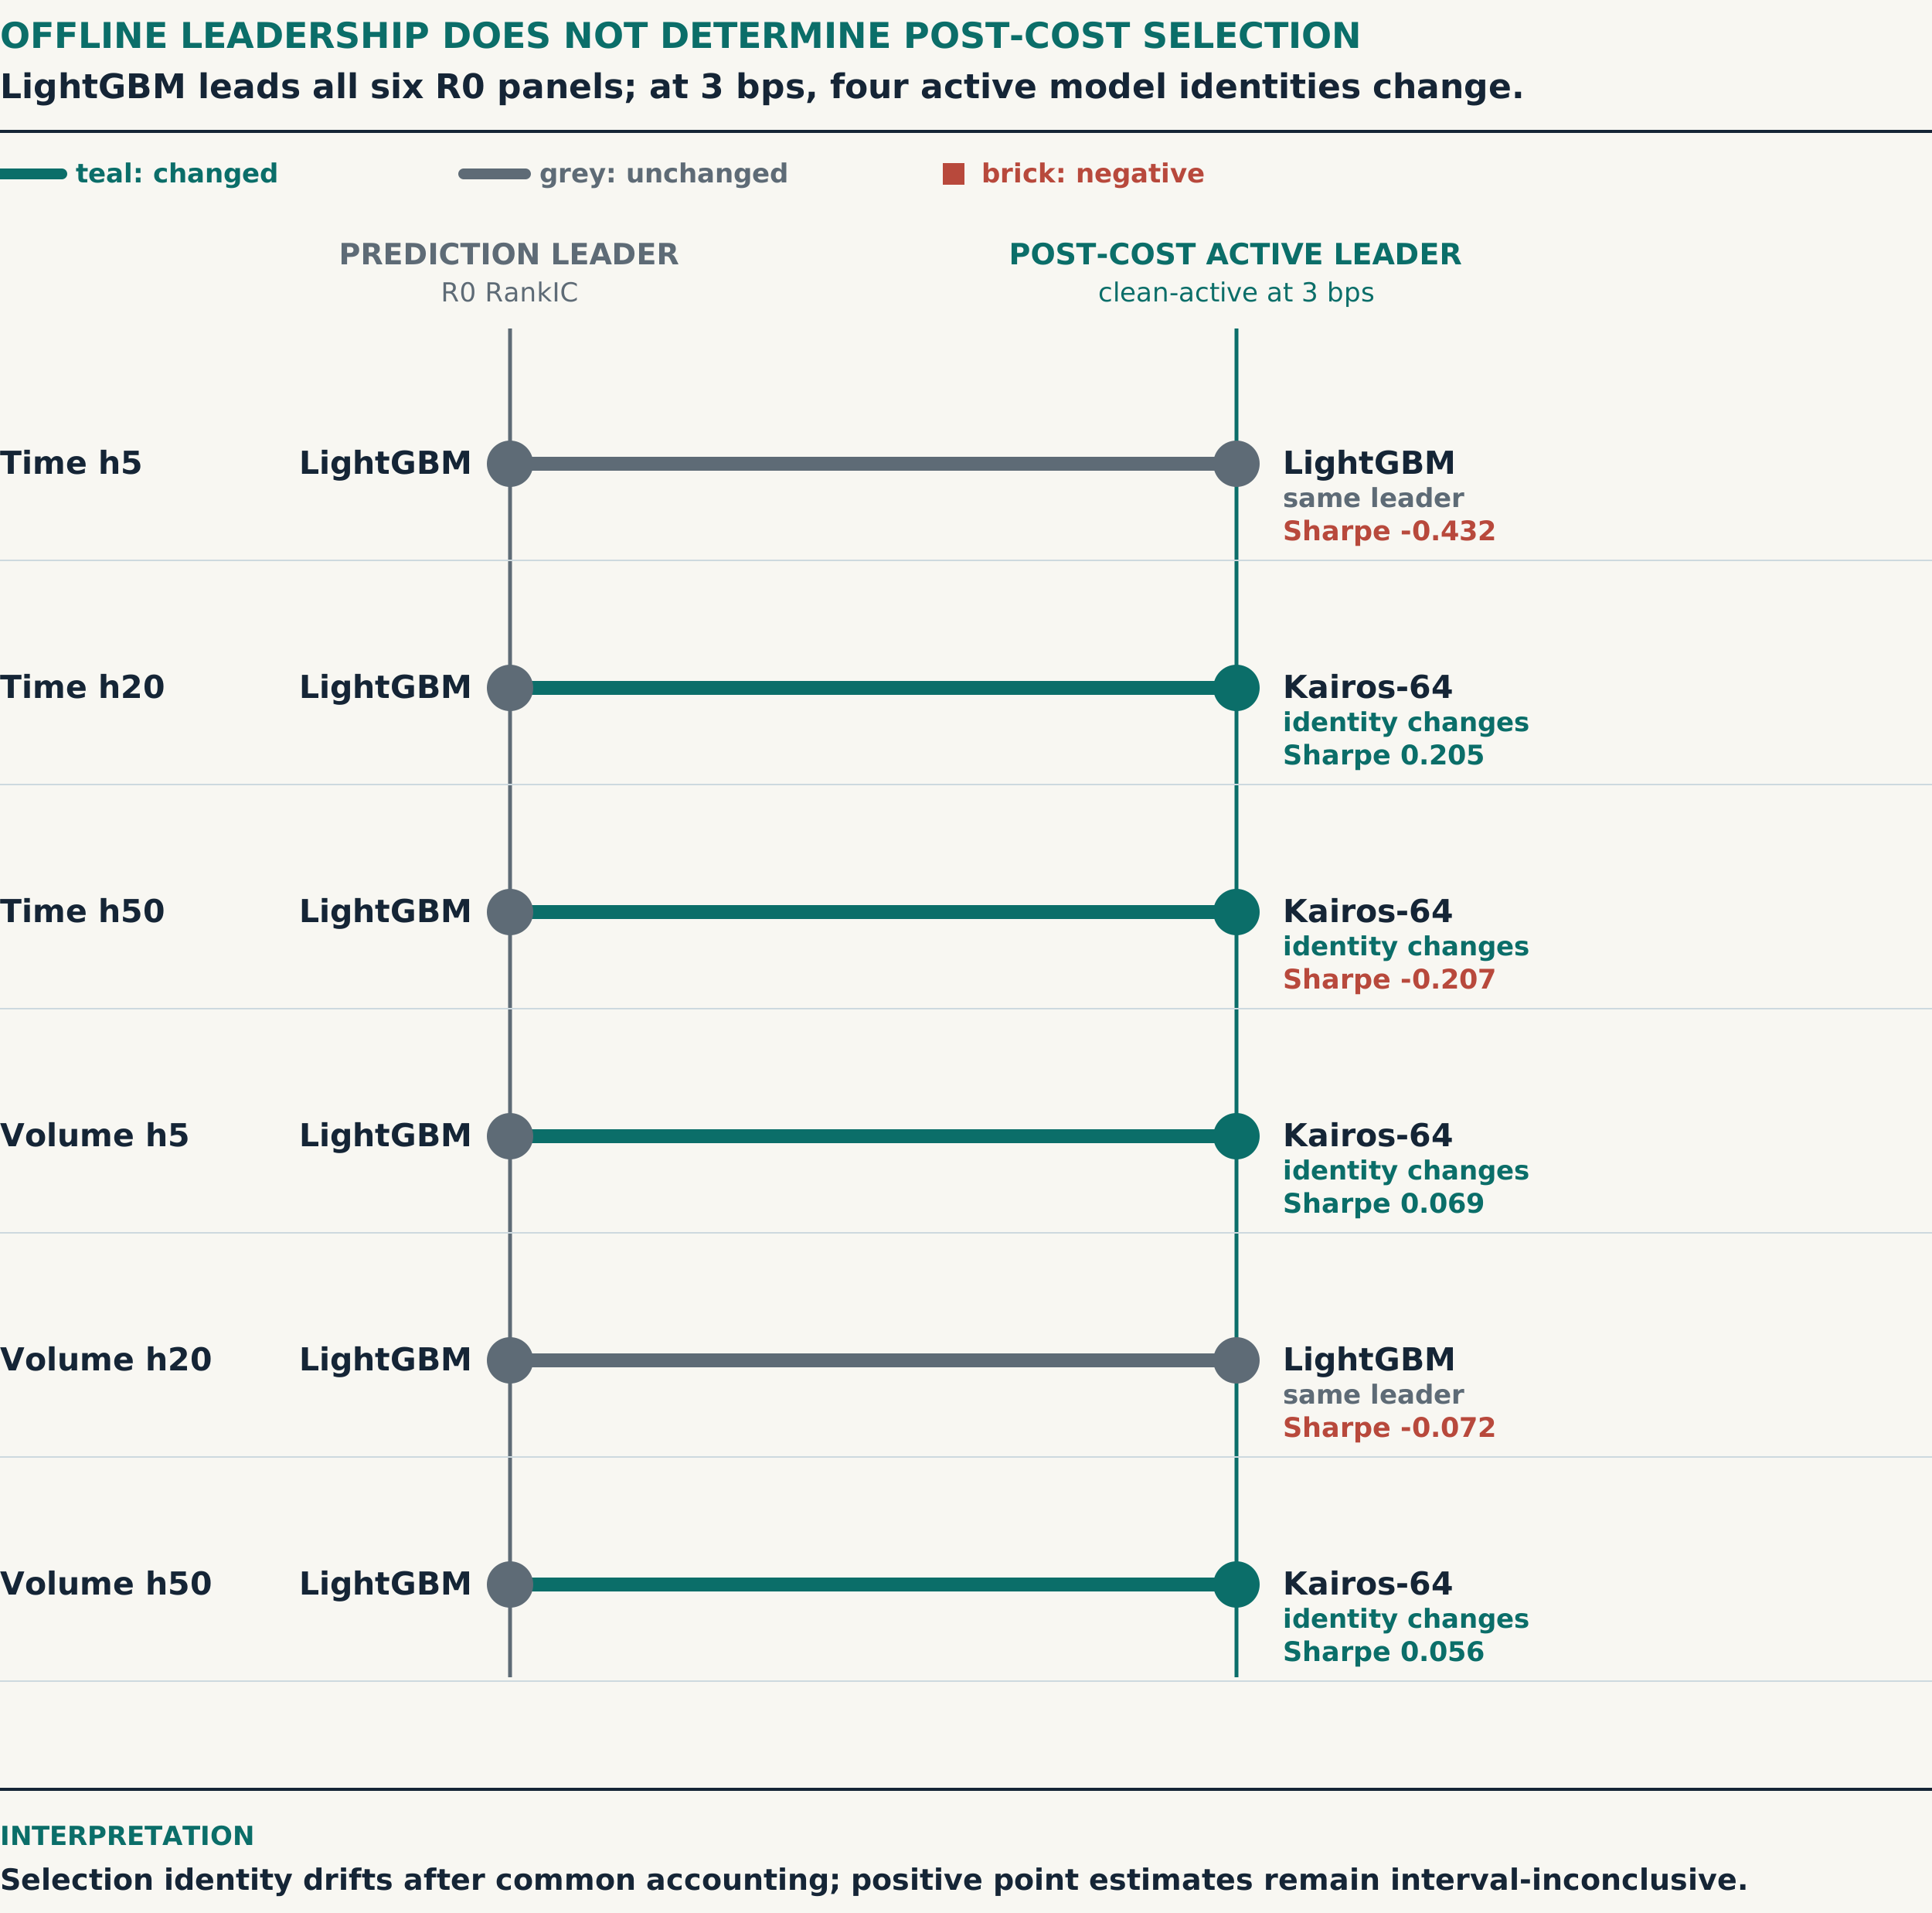
| Panel | R0 top predictor | R0 RankIC | R4 top active method | R4 Sharpe at 3 bps | Day-block 95% CI | Result |
|---|---|---|---|---|---|---|
| Time h5 | LightGBM | 0.145 | LightGBM | -0.432 | [-0.630, -0.239] | same; negative |
| Time h20 | LightGBM | 0.079 | Kairos-64 | +0.205 | [-0.137, +0.613] | leader changed |
| Time h50 | LightGBM | 0.047 | Kairos-64 | -0.207 | [-0.529, +0.096] | leader changed |
| Volume h5 | LightGBM | 0.274 | Kairos-64 | +0.069 | [-0.174, +0.325] | leader changed |
| Volume h20 | LightGBM | 0.220 | LightGBM | -0.072 | [-0.331, +0.012] | same; negative |
| Volume h50 | LightGBM | 0.171 | Kairos-64 | +0.056 | [-0.256, +0.378] | leader changed |
Positive R4 point estimates have intervals crossing zero. The table establishes leader-identity changes and evidence boundaries, not statistically secure positive utility.
Protocol note
Official RR@1 is 1.0 across the six prediction-first panels when k=1 and deterministic stable sorting are used. It is a protocol-level gap diagnostic. The clean-active R4 audit asks whether the active R4 model identity changes after non-active safety-floor rows are excluded from the active model comparison. Neither value should be substituted for the other.
Panel bootstrap
Mean Ranking Gap: -0.541 with 95% CI [-0.852, -0.259]; winner-change rate 0.667 with 95% CI [0.333, 1.000]. These estimates use six panels and 1,000 panel resamples. They are not day-level inference.
Open the bootstrap table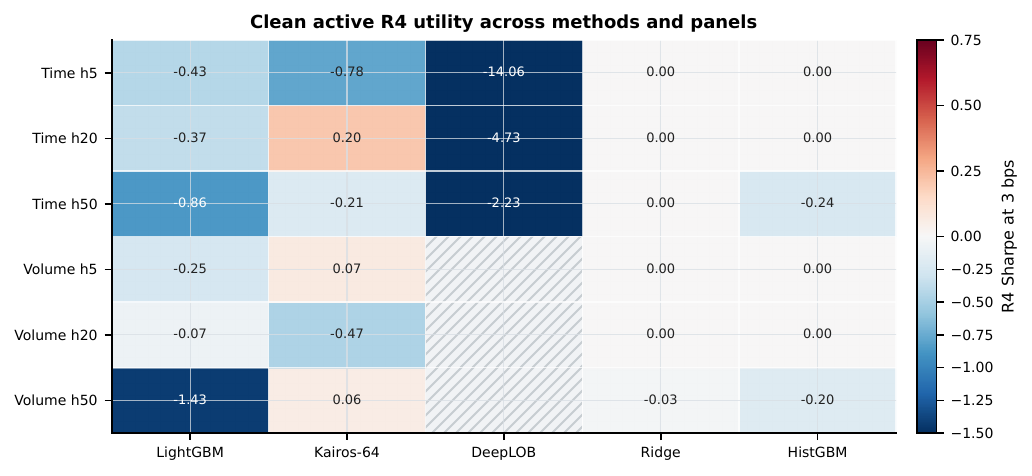
Limitations
| Limit | Consequence | Correct reading |
|---|---|---|
| 90-day evaluation window | Headline comparisons use one frozen 90-day window. | Persistence beyond this period and market regime remains untested. |
| Licensed market data | Raw L2 feeds and reconstructable tensors are not redistributed. | Inspect normalized evidence and evaluator code; do not infer raw-data access. |
| Six populated panels | The result is a completed evidence slice, not a universal market claim. | Read the conclusion within the fixed dates, assets, venues, views, and horizons. |
| Confidence-interval uncertainty | Every positive R4 point estimate has a day-block 95% confidence interval that crosses zero. | The finding is a ranking-identity and evidence-boundary result, not statistically secure positive utility. |
| Clean-active eligibility | Clean-active selection excludes zero-action safety-floor rows and non-active anchors. | Compare identities only within this eligible active-method universe; keep official RR@1 separate. |
| Incomplete method panel | Several target families have no normalized 90-day result rows. | Target-only methods are explicitly not claimed as completed baselines. |
| Evaluation, not deployment | Approximate frictions and frozen replay do not reproduce production operations. | Use the benchmark to audit evaluation conclusions, not to claim deployable returns or readiness. |
| RR@1 diagnostic | RR@1=1.0 uses k=1 and deterministic stable sorting in the official universe. | Keep it separate from the clean-active R4 identity result. |
Completed evidence
LightGBM, Kairos, DeepLOB, and Ridge/HistGBM-style controls are reported where implemented under the shared evaluator.
Diagnostic evidence
Execution wrappers and OG-PA/DPO rows are informative sensitivity evidence, outside the clean active leaderboard.
Not claimed
Additional target families do not yet have normalized 90-day evidence under the same evaluator.
Engineering applications
Illustrative transfer scenarios. These domains were not evaluated in the released benchmark.
Engineering boundary: PEG-Bench is an evaluation protocol and audit artifact. It does not replace domain-specific validation, governance, or production risk review.
Materials
The technical report explains the method and appendix. The repository routes below expose the normalized evidence, implementation, provenance, integrity manifest, and release boundary needed for an audit.
Reference record
PEG-Bench (2026). When Prediction Leaderboards Fail: Benchmarking the Prediction-Execution Gap. Technical report.
https://computational-decision-lab.github.io/peg-bench/
Public release boundary
This public release includes the evaluator, schemas, split and stress manifests, normalized evidence, generated tables, figures, and inspection samples.
It does not redistribute raw vendor L2 feeds, tick-level trades, or full processed tensors derived from licensed data. Full raw-data reconstruction requires authorized access to the underlying market-data provider.
Read the release scope